The crime rate is an appropriate indicator to show whether a city is safe to live in and it is also a reflection of the living standard and policing effectiveness. The government carried the gentrification in the Downtown Eastside area, which has increased the displacement of marginalized people and encouraged the flow of homeless people to move to Chinatown neighborhood.
Given all the information described above this project aims to create a map to explore the relationships between crime rate and immigrants and also between income level and crime rate. Specifically, we focused on the break and enter (B&E) for the crime rate category which allows us to compare one type of criminal ofense with income level and immigrants.
The data we found is from an open data source including Canadian Census, City of Vancouver and Statistics Canada. Census data is usually utilized in many geographic analysis research projects such as immigration policy analysis and crime prevention etc. In this project, we will use 2011 and 2016 data on immigrants and income level to visualize the change of break and enter crime occurrence over 5 years.

Methodology
a. Acquire
Spatial data (Metro Vancouver Census Tracts boundary maps) are downloaded from Abacus Datavers Network for the last 2 census intervals — 2011 and 2016. Tabular data (immigration, income and crime data) are acquired from Statistics Canada and City of Vancouver Open Data. Variables of immigration and income conditions are downloaded from Canadian Census Analyser, which is organized by the University of Toronto and can be accessed through UBC Library. We choose 2011 NHS and 2016 for census year and pick “Profile of Census Tracts”. In the following page, we specify our census geography as Vancouver and the variable as “Imm, Gen à recent immigrants, total” and “Inc à individuals inc., total” and downloaded the data as dBase (DBF) files for both years. Crime data is acquired from the City of Vancouver open data catalogue à list of datasets à crime shp.
b. Parse and Filter
We first set the projected coordinate system as “Transverse Mercator UTM Zone 10N” since the area of our research is the City of Vancouver, and extract out the base map of Metro Vancouver by selecting the attribute as “CMANAME = Vancouver” in the attribute table and exporting the selected features into a new layer. We zoom in the City of Vancouver as our research area.
c. Mine
We join the tabular data of immigration and income to spatial layers for display and analysis. In the Join window, we select the Field to be used for join as CTUID, Table as Income2011 and the Field in the table as COL0 and check “keep only matching records”. After finishing Join, we open the attribute table and change the alias from COL1 to income2011 so that it would be easier to display the data for the following analysis. And we repeat the steps of Join for income2016, immigration2011 and immigration 2016. As for crime data, we narrow our research to the cases of Break and Enter by selecting the attributes as “TYPE = BNE Commercial and BNE Residential/Other” and exporting into a new layer.
d. Represent
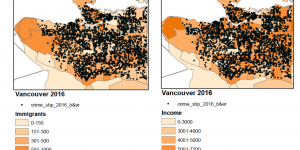
We use four choropleth maps to represent our variables so that we could compare the changes by years (2011 and 2016) and between the variables (income and immigration). For classification method, we look through the distribution of data and use manual break method according to the characteristics of the datasets in order to follow the same break rules for the same variable, so that the comparison between years would be reasonable. In addition, it would be easier for the audience to read the maps. The same color ramp is used for the same year for comparisons between variables. Maps are presented in portrait view. All the standard map elements including scale bar, north arrow, legend, title, names of group members, coordinate system information and data source were properly added to the map. Lastly, the map was exported as a PDF file.
Results and Discussion
The City of Vancouver attracts a lot of immigrants, especially in the Westside (areas to the west of Main St.). Residents in Westside also have higher income level comparing to the other parts of Vancouver. In Westside, Break and Enter rate is extremely low in both 2011 and 2016. However, it is important to keep in mind that UBC -- at the very end of Point Grey, is not included in City of Vancouver administration and that the crime data published by City of Vancouver government does not apply to UBC.
From the maps, we can see that downtown Vancouver is the area with higher income and more immigrants; however, the Break and Enter rate is much higher than Westside. What factors drive the difference between Westside and Downtown Vancouver?
By looking in depth in Downtown Vancouver area, we can see the individual income in Downtown Eastside ranges from 0 to 4000, which represents the lowest income level. And the occurrence of Break and Enter is relatively high comparing to other neighborhoods and shows no improvements between 2011 and 2016 although several government plans have been published in order to solve these issues.
The City of Vancouver government carried the gentrification process in Downtown Eastside, a process referred to the renovation of deteriorated urban neighborhoods to a middle-class neighborhood (Burnett, 2014). It begins in the neighborhood across the road at the South East corner of Pender and Heatley and is deeply associated with displacement of low income and marginalized residents. Because after the renovation, house rent will significantly increase, which would force people to leave and give rise to homelessness. Gentrification compels people with lower income to move out, as the rent has been increased and they cannot afford to live any longer. From a news journal article, Rosesari, a 92-year old Chinese woman living in May Wah Hotel, has to pay $320 a month for a room with shared kitchen and bathroom (Li & Li, 2011). The living conditions were not ideal and the sanitary conditions of common areas are not satisfactory. Therefore, gentrification is often defined as urban regeneration, which relies on discourses promoting the value of social mixing, yet it results in income polarization, localized inequality and social exclusion (Burnett, 2014).
This can explain one of the reasons why the number of recent immigrants in Downtown Eastside is smaller than other places -- poor living environments act as a constraint on boosting the quality of life in this neighborhood. In recent occurrences of immigration indicate racial heterogeneity, considering the migrant population (Chinatown, for example) variables may capture a form of social cohesion in specific places. In addition, due to a lack of English language skills or local knowledge of police roles, areas with a higher percentage of new immigrants may suffer from underreporting crimes (Andresen, 2006).
As gentrification increases the population of homeless people, the unemployment rate will also increase consequently. When people do not have a stable income to sustain their life, it usually gives rise to drug addiction and mental health problems, which can explain high crime rate in Downtown Eastside.
We can conclude several phenomena:
1) Poor neighborhoods tend to have a higher rate of Break and Enter.
- People with lower income were difficult to sustain their life, which provides a ‘motivation’ for them to commit a crime. Taking Chinatown as an example, residences in Chinatown were poorly constructed with a lack of security systems, which would be “perfect targets” for Breaks and Enters. One of the related issues is that the single room occupancy hotels (SROs) in Vancouver Downtown Eastside have been shut down for maintenance. The SROs are identified as slum areas because of poor sanitation and management. People in slums are marginalized in urban areas due to the reduction of subsidence and this lead to inequality of class in urban areas. The shut down of SROs led to an increase of homelessness and forced people to move into poorly constructed residences and the hazardous areas in Chinatown along Powell street. It increases homelessness occurrence along the streets in Chinatown, which lower the image of the Chinatown and also hinders the root of the increasing rates of mental illness and drug addiction population.
2) Neighborhoods with a larger population of recent immigrants are likely to have a lower rate of Break and Enter.
- We can explain the inverse relationship between crime rate and the number of recent immigrants from different perspectives. Firstly, many factors are taken into account when they are considering places of residence. For example, some people may have chosen to migrate for better job opportunities and would be more likely to dwell in the workplace. On the other hand, for immigrants planning to live in Canada permanently or for a long time, they may do some investigations on places to reside in advance, since more factors would be concerned. Before they move in, not only their work but also resources and infrastructures around the neighborhood would be considered (i.e. shopping centers, hospitals, schools, parking, public transportation etc.). Safety conditions, more importantly, would largely affect their choices, and as a consequence, they tend to avoid living in areas with frequent Break and Enter cases. Among these immigrants, those who are wealthier will have more choices so that they tend to settle in more expensive and safer places with more effective security systems. As a consequence, crime rates of these areas will also decrease since criminals would also avoid those neighborhoods.
- Immigrants can actually bring the crime rate down. A lot of statistics found that immigrants are less likely to engage in criminal behavior. “A University of Toronto study initiated more than thirty years ago provides some of the most convincing evidence to support the theory that more immigration equals less crime. The overall rate of what they called “youthful illegalities” — drinking, taking drugs, petty theft, vandalism, fighting, and so on — was significantly lower in the immigrant-rich 1999 cohort, and in both groups immigrant kids were less likely than their peers to engage in delinquent behavior” (Rachel, 2011). Studies also found that the rates of youth crimes among recent immigrants tend to be lower than the other Canadians. Even those kids who were the first generation of their family to be born in Canada were still less likely to commit a crime than kids whose parents were born in Canada. Because immigrants were said to actually change the characteristics of a neighborhood or the behavior of the people these could result in a long-term decrease in crime rate. Because For immigrants, they come to a completely new environment, they need to be immersed in the environment and need to be humble, manage their own behaviors, and let the people in the neighborhoods see their own good performance. For the children of these immigrants, they saw the parents’ efforts and sacrifices for immigration and they feel obliged to do well.
Error and Uncertainty
As Monmonier (2018) stated in his book called How to Lie with Maps which is related to cartography, “ To make a map is to lie.” That is, GIS is only a model of reality, which contains unavoidable errors and uncertainties, and what we have done in this project is creating a model to explore the relationship between crime rate and immigrants, and the relationship between income and crime rate.
The sources of error are throughout the entire GIS analysis process. The first the source would be sampling collection and measurement. As it is mentioned above, our data sources include Canadian Census, City of Vancouver and Statistics Canada; whereas, these sources could not provide all the data for the public due to various reasons, which led to lack of data and unavoidable error during data presentation and analysis. Also, the resolution of the DEM which contains raster data would determine the accuracy of datasets. If the pixel size is larger, the resolution will be coarser, and the data will be less accurate. If the pixel size is smaller, the resolution will be finer, and the data will be more accurate. The resolution of the dem data is 25m which is a fine resolution, but the error still exists, compared with the real world.
The second source of error would be data conversion.We used UTM Zone 10 as the projected coordinate system, which maintains angles but distorts areas and causes a little bit tearing at high latitude areas and poles. Whereas, our maps are on a small scale; that is, the maps would be similar even if different projections are used, so the areas would not be influenced significantly.
Furthermore, the error could occur during data analysis, especially as we were doing classification. How information is presented would never be unbiased; nevertheless, with an appropriate type of classification, the map would be closer to the truth of what it is meant to depict. There are four different classification methods we have learned. Based on the purpose of the map, Manual Breaks was determined to be the most appropriate method to make the comparison between the data in 2011 and 2016 and was used in our data analysis. Although Manual breaks do a fair job of comparing data, the break values were determined by GIS operator, not a computer algorithm. Also, in order to make the comparison more intuitive, the manual break values are usually rounded, which would not be accurate; for example, a natural break might be at $7,095 whereas a manual break would be placed at $7,000. Ethical implications arise in the manner and context in which the map is presented, not in the classification. Some background information on the classification method used should be included in the presentation. If the legend is clear, and the classification method is discussed or referenced, then the presentation should be ethical.
In addition, data display would be one of the sources of error. As we were doing data representation step, considering the comparison of crime rate in Vancouver in 2006 and 2016, we used two different color ramps to display information in two different years. Our goal is to help map users distinguish the maps for different years more easily; however, this led to the fact that we used the same color ramp to present the two different variables - immigrants and income for one year. In this case, if map users do not read the legend carefully, it would be difficult for them to find the difference between the two maps for the same year.
Further Research and recommendations
The living standard of a neighborhood is directly affected by many factors, such as hygiene, transportation, criminal activities, and illegal activities, etc. The future research can be about the best neighborhood in Vancouver, by considering the crime rate and illegal activities, such as drugs.
The relationship of drug activities and the crime rate is interesting to explore. In the society, a lot of bias on drug and crime issues. The Cannabis legalization was just approved in Canada; however, cannabis treats as an illegal drug in some countries. The future research can explore the drug activities and the crime rate in Vancouver. The amount of crime rate can reflect the public security of the neighborhood. In order to improve the neighborhood atmosphere and security, we think the government should boost the promotion of drug rehabilitation. Although the Vancouver government has offered more police to patrol regularly in these areas, the drug activities are still very active in the Chinatown. Rehabilitation programs need to work closely with the patient, the most successful programs offer a variety of options including residential inpatient treatment, extended care center, addiction counseling, outpatient treatment with local support groups (Mjaland, 2015). The drug rehabilitation is a long-term process and required the cooperation between the government and the victims.
To investigate the drug activities and crime rate in the different neighborhoods in Vancouver is a benefit for the research about the best living neighborhood in Vancouver in the future.
Another interesting point to think about is to discover whether there is any relationship between crime rate and the number of police station available in a certain area with its distance. To do this, we need to go to the city of Vancouver to download the data of police station, the layer contains vector data and will represent in points, pick a point symbol that is easy to see overtop of dem colors. Because the crime layer also shows in points, thus it is important to use a distinctive color to distinguish police station from the break and enter crime. In addition, we can pick to label the name of police stations, for research purpose to explore which police station was effetely reduced crime rate.