
- Quantitative Data Classification
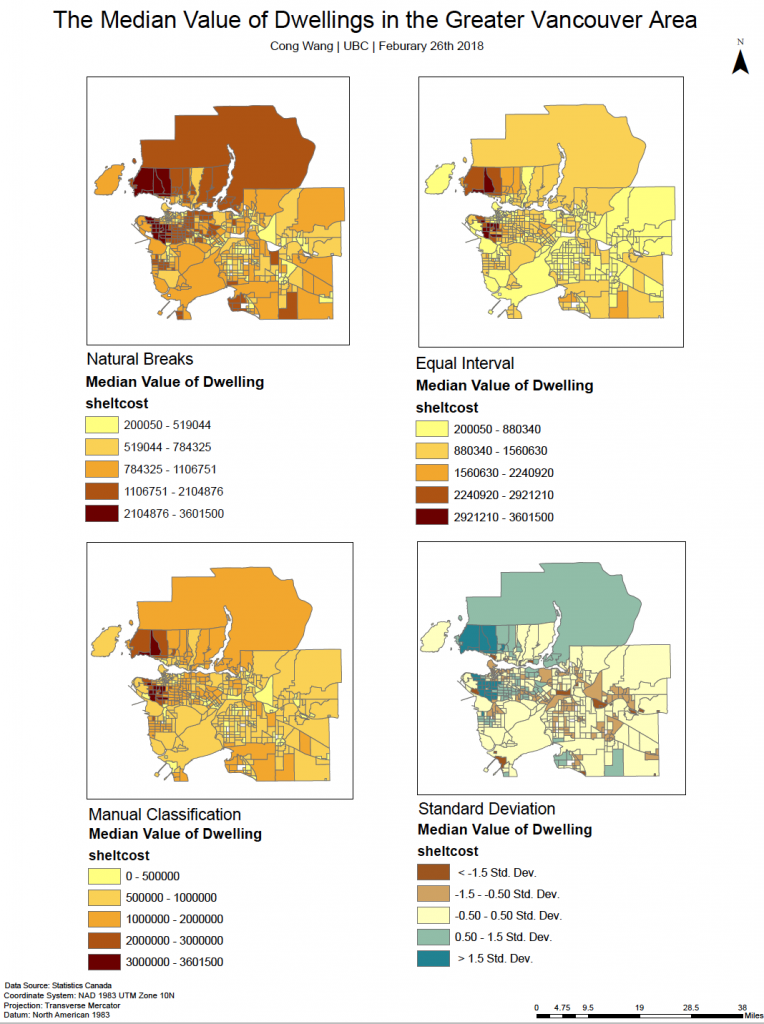
The classification of quantitative data is an extremely important process in GIS. However, it is also a process which involves ethical questions relating to the information delivering to the reader. Because it displays how social data interacts with the physical environment, it is necessary to take into account whether the classification method being used is right for presenting the data.
The above map shows the same data analyzed using four different classification methods, and different conclusions can be drawn based on the mode of analysis. Therefore, it is very important to understand the purpose of the map. For example, if I was a journalist and I wanted to choose a classification method to present the data to my readers, I would choose the classification depending on the point of my article. If my goal is to present Vancouver’s exaggerated livability due to the unaffordable housing in the city, I would probably choose Natural Breaks, because it would have the most shock value to display the unaffordability to live in certain areas of Vancouver.
Furthermore, if I were a real estate agent and tended to use maps to convince my client to buy a house near UBC, my choice of data classification would depend on the situation of prospective buyers. If they had many budgets, I would show them the Manual Breaks. Although housing prices near UBC are expensive, manual breaks could provide them the best location and access based on price. If they have few budgets, I would provide the Equal Interval map to show that housing costs in that area are lower than the actual price.
2. Housing Affordability
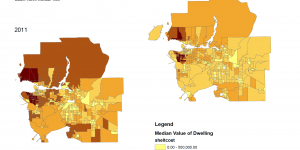
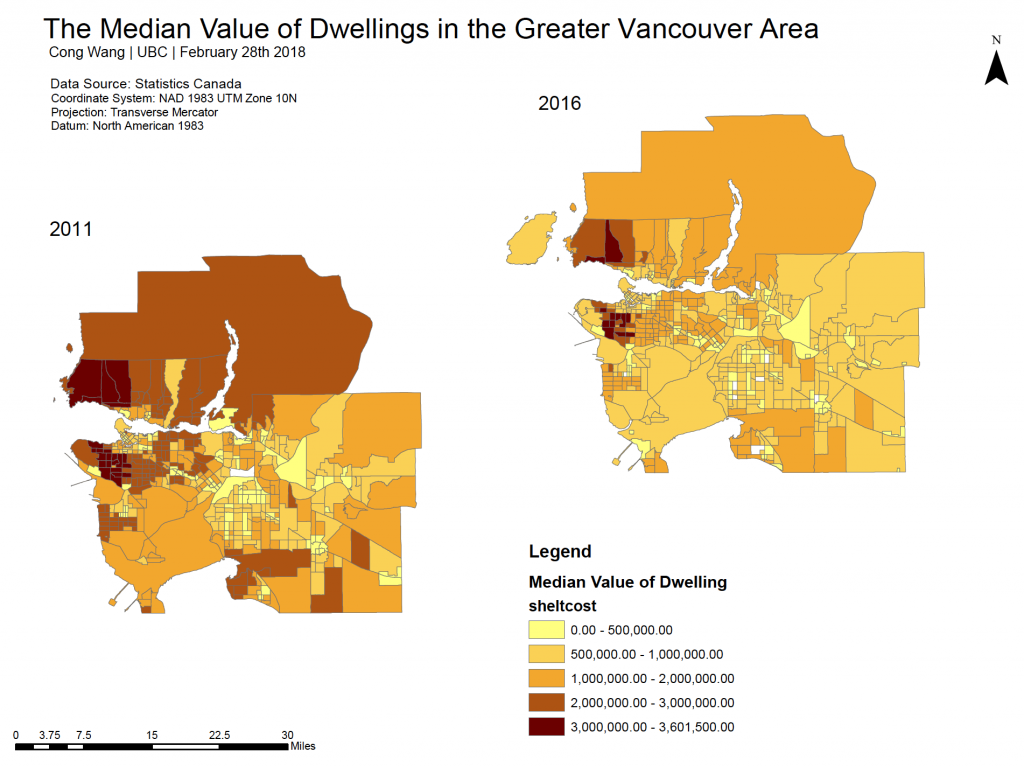
The map above delineates the comparison of the median value of dwellings in the Greater Vancouver area in 2011 to 2016.
Housing affordability is defined as the ratio of household income to cost of owner dwelling. If housing costs are very high in a city, but people in that city are, on average very rich, it may be reasonable to identify the area “affordable”.
In addition, shelter cost refers to the average monthly total of all shelter expenses paid by households that own or rent their dwelling. According to the map, the median value of dwellings in the Great Vancouver area has changed significantly from 2011 to 2016. In general, compared with the value in 2011, the value has decreased dramatically in the most areas in Great Vancouver in 2016.