In this scenario, I was assigned as a GIS analyst with Metro Vancouver. Given climate change weather events that have transpired recently around the world, including recently in Tofino on Vancouver Island with the waves and flooding, I was assigned to create a series of maps to highlight the areas in the Metro Vancouver at risk to flooding or a storm surge. The immediate danger zone is mainly to the low elevation areas at, or below, 10 m that lie up to 1 km inland from the shoreline.
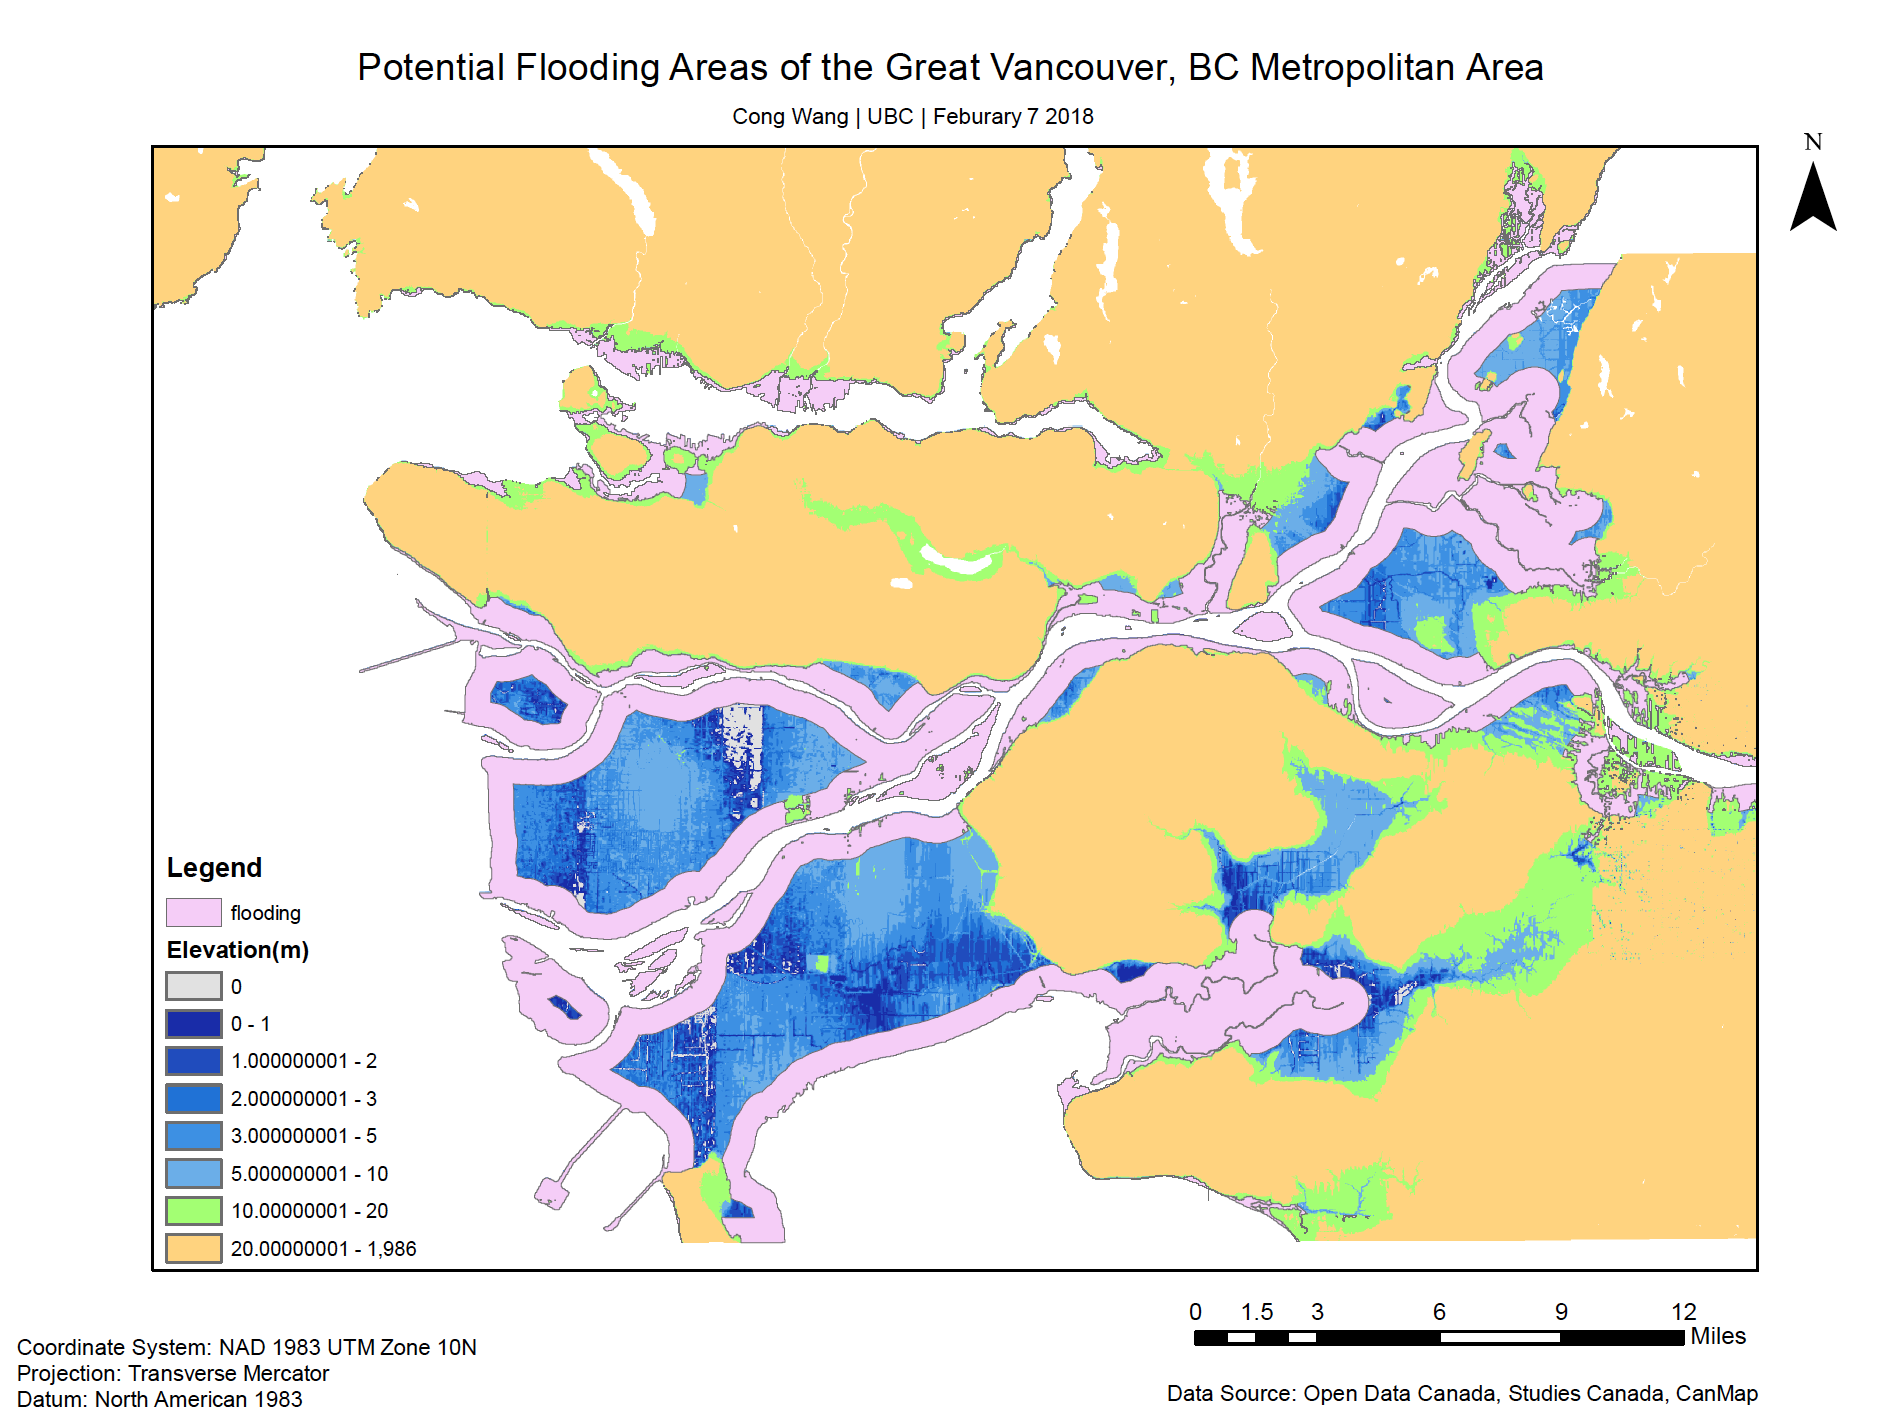
The map above displays areas of the Great Vancouver which would be affected by potential flooding. I buffered the shoreline of 1km and calculated the areas at risk of flooding, which is 597.853125 km^2, using ArcGIS.
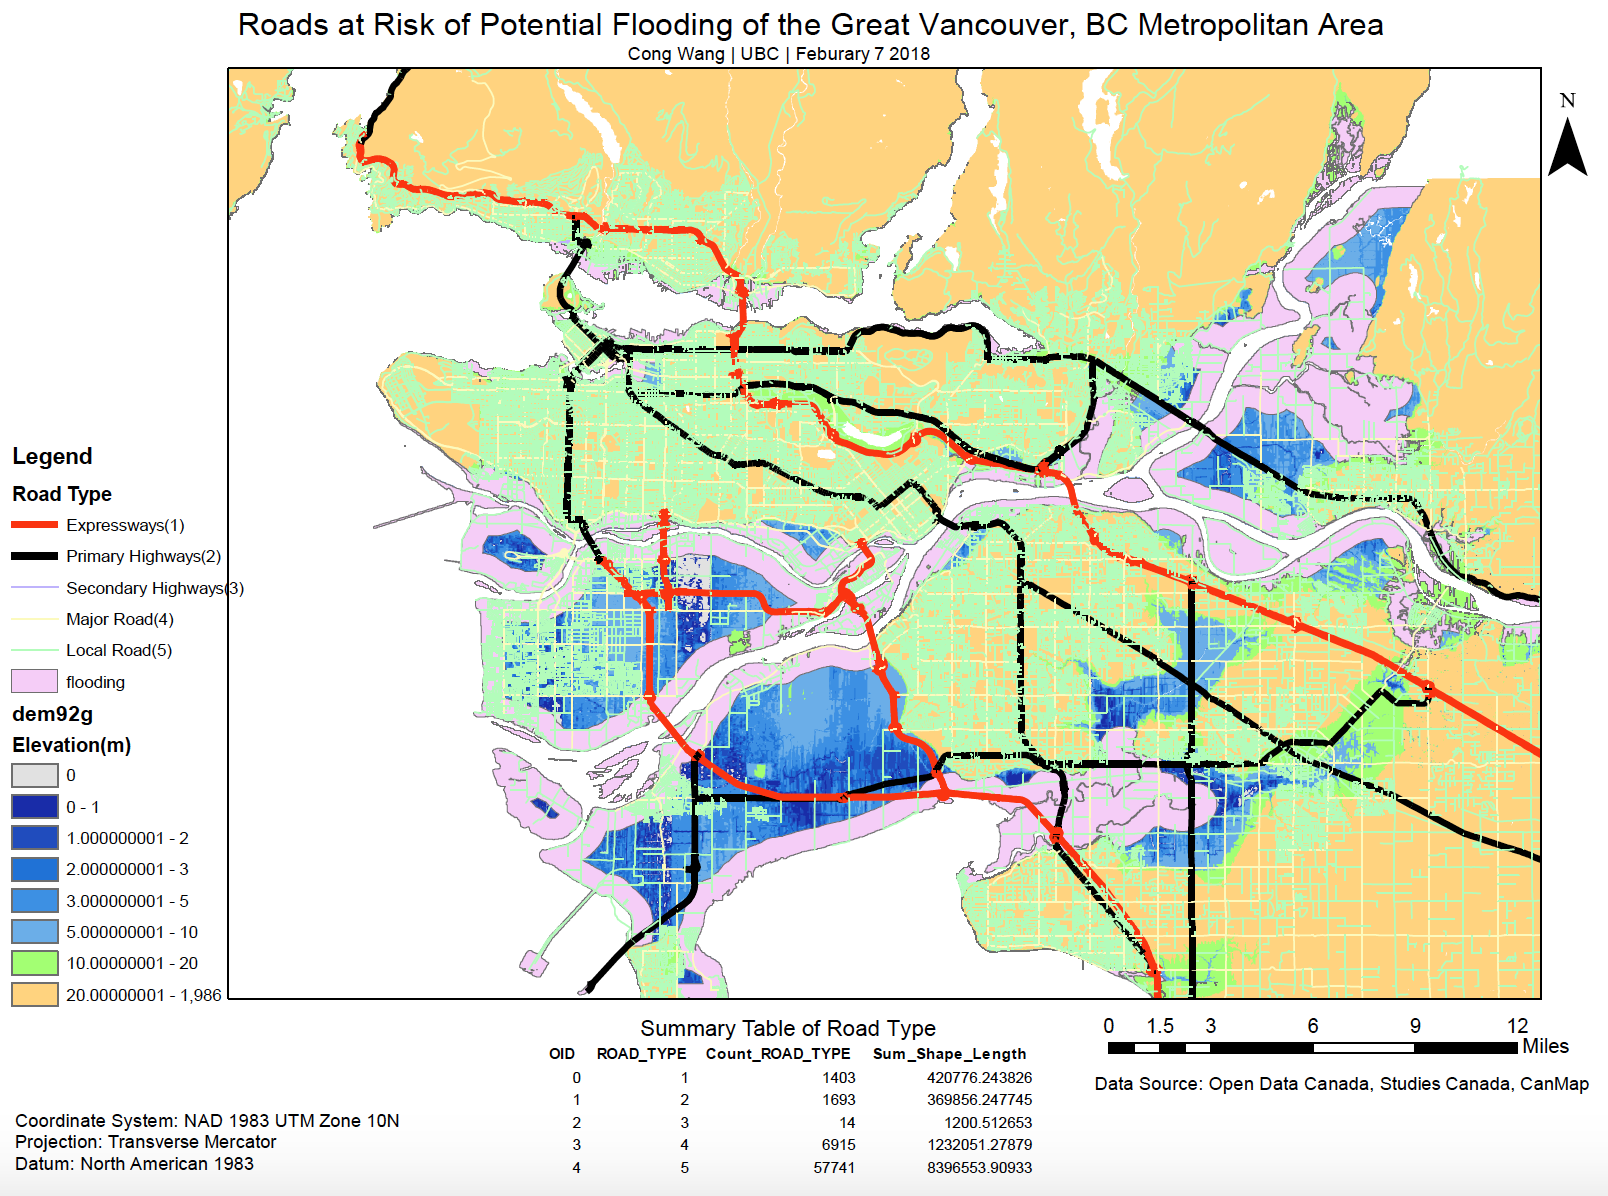
The map above delineates roads in different types at risk of potential flooding in Great Vancouver. There are five types of roads, including expressways, primary highways, secondary highways, major roads and local roads. From the map, we can see that some parts of expressways (369.856247745km), primary highways (420.776243826km), and local roads are within the flooding area and would be affected by the potential flooding.
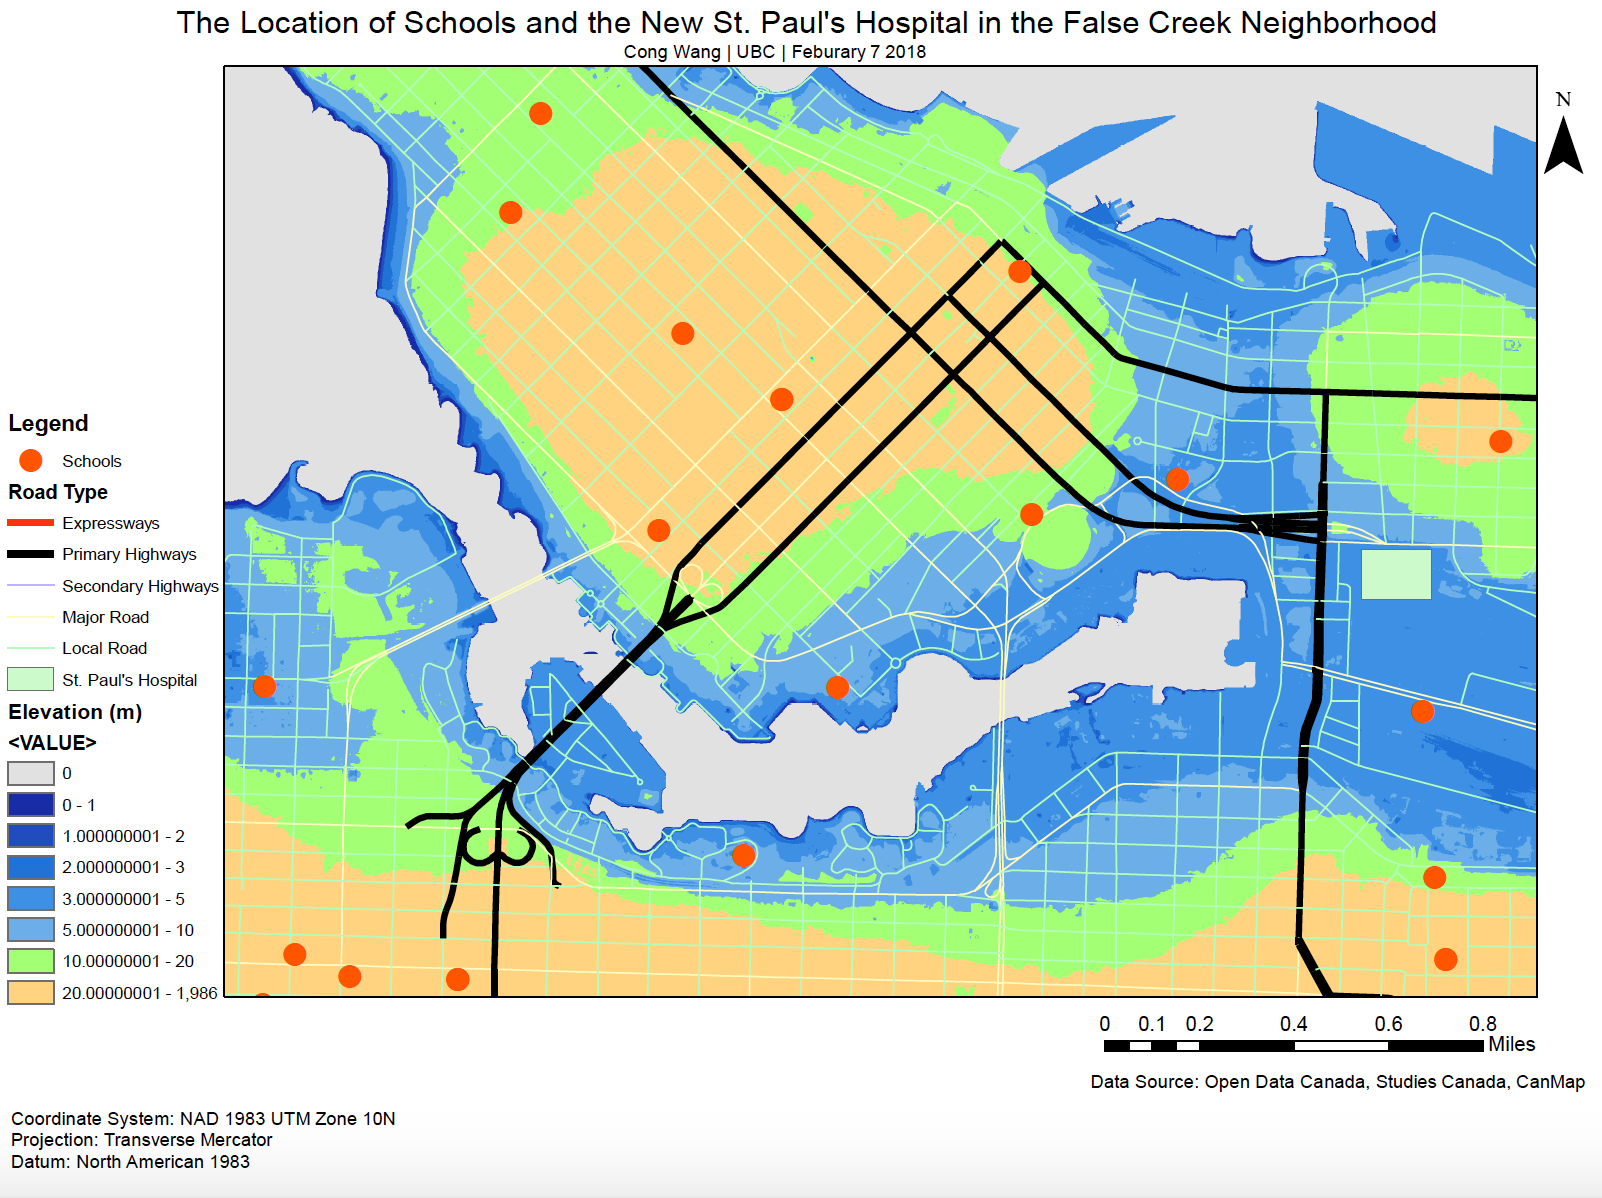
The map above illustrates the detail of False Creek tidal flats area including finer resolution elevation information, map of schools, and new St. Paul’s hospital location. After I made the calculation about how many schools are within the low elevation area, I got that 36 schools fall within flooding areas.
In this lab, I learned how to make calculations using ArcGIS, and I also learned that different resolutions can influence the accuracy of calculation and the representation of the map.